The delay no one planned for
Picture a scenario most engineering managers will recognize. A senior engineer takes planned leave: marked in the team calendar six weeks ahead, communicated clearly, with handover notes written. Yet within 48 hours, a deployment that should take four hours is blocked, a data pipeline fix is stalled, and three people are digging through a Confluence space trying to find out who approved the exception logic in the payment batching service and why a specific edge case was handled the way it was.
No one was understaffed. No one was overloaded. The project stalled because the knowledge needed to move the work forward was held in one person's working memory, and nobody realized those knowledge pathways existed until they became unavailable.
This is precisely the class of delay that organizational knowledge graphs are designed to surface before the absence event. Not by mandating more documentation, but by making the dependency structure visible enough to act on in advance.
What knowledge pathways actually are
A knowledge pathway is more specific than a documented process or a runbook. It is the sequence of context, decisions, people, and accumulated understanding that must be activated to complete a piece of work accurately. It includes who originally made a design decision, who has since worked with its downstream effects, who knows where the edge cases live, and who can reliably distinguish between "this is how the process is documented" and "this is what actually happens in production."
Standard wikis capture the surface layer of this sequence reasonably well. What they cannot reliably capture is the live ownership structure: who is actively engaging with a process today, and which informal dependencies have accumulated around it as the team has grown and rotated.
A Confluence page on the payment reconciliation workflow may have been accurate when it was written. It will not tell you that two of the three listed owners moved to other parts of the organization in the past year, or that the process was updated to reflect a decision that was later reversed but whose documentation was not updated to match. The page is a static artifact. The knowledge structure it attempts to describe is not static.
Why graph structure surfaces what documents cannot
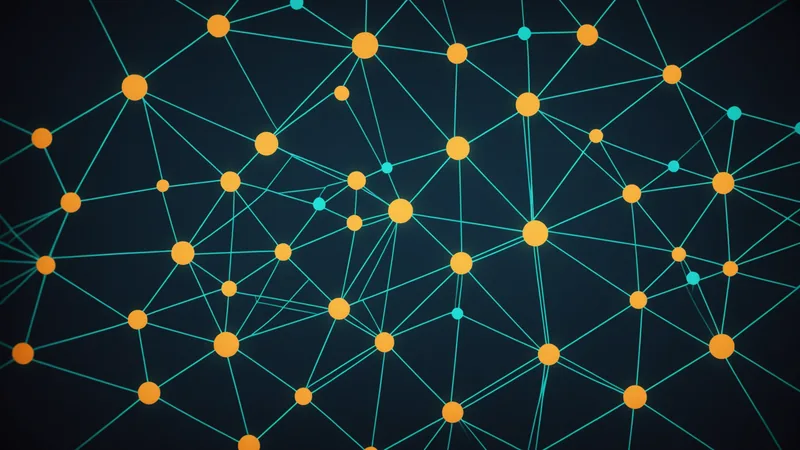
The critical insight about modeling knowledge as a graph is that the important information lives not in the individual nodes but in the pattern of connections between them, and specifically in patterns of connection concentration.
When a knowledge graph shows that 14 operational processes all route to a single person as their only active participant in the past 90 days, that is a measurable risk signal. When those 14 processes also sit on the critical path for a quarterly close cycle that overlaps with a scheduled leave period, the risk becomes concrete and time-bounded. You can see it before the absence event creates a crisis, which means you have time to address it.
Flat documentation systems cannot surface this because they are organized around topics rather than connections. "What is the payment reconciliation process?" is a topic question that a well-maintained wiki can answer. "Which three people does this process functionally depend on, and when is each of them next unavailable?" is a relational question. Only a graph can answer the second one with any reliability.
Brekfuz builds this graph from the activity signals your team already generates: Slack message patterns, Jira task history, Confluence edit records, GitHub commit authorship. The result is a model of actual knowledge ownership as reflected in behavior, not as declared in a header field someone filled out during onboarding two years ago.
A pattern from early-access work
One finding that comes up repeatedly in early-access teams is the gap between nominal ownership and active knowledge ownership. A process can have three people listed as co-owners in a wiki and still be functionally single-threaded if only one of those people has engaged with it in the past several months. The other two have drifted into other areas. Their names remain in the documentation, but their working knowledge of the process has faded.
Consider an operations team of roughly 60 people that had grown quickly over 18 months. Their documentation was genuinely well-maintained: an active Confluence space, a diligent documentation lead, regular process reviews. When they built an initial knowledge graph from their activity data, the analysis surfaced 22 operational processes where only one person had engaged with the process in a meaningful way during the prior quarter. Not the only listed owner. The only recent active participant.
For 11 of those 22 processes, that single active participant was about to take on a major initiative requiring extended travel over a six-week window in Q4. The team had four months of lead time to address those dependencies. That lead time came from visibility they did not previously have, despite having what they genuinely believed was good documentation coverage.
The documentation was accurate as far as it went. It just could not show the difference between nominal ownership and active knowledge ownership, and that difference is where project risk actually lives.
Where this approach has real limits
We want to be direct about what knowledge graphs do not do. They surface the structure of dependencies. They do not transfer knowledge, resolve gaps automatically, or prescribe exactly what backup arrangement to make for a given process. The judgment about how to act on what the graph reveals belongs to the team, not the tool.
We are also not arguing that every team needs a knowledge graph from day one. Small, stable teams where everyone has worked together for several years often maintain accurate shared mental models of their dependency structure without any formal tooling. The graph becomes most useful when the team is growing fast enough that the informal shared model stops keeping pace with reality, or when turnover has introduced knowledge gaps that nobody currently has clear visibility into.
There is also a signal quality factor to account for. A knowledge graph built from activity data reflects only what those signals can observe. If significant knowledge work happens in private conversations or verbal handoffs that leave no digital trace, the graph will have gaps. The right response is to treat the initial version as a structured starting point for conversation rather than a complete audit. The gaps in the graph are themselves informative: they point at the processes most dependent on informal channels, which are precisely the ones where a knowledge transfer program would add the most value.
The planning question that changes
The teams that extract the most practical value from knowledge graphs are not the ones treating them as reports to review periodically. They are the ones using them as planning inputs, specifically for the window before high-risk periods.
When you can see which processes have single-point dependencies, you can make deliberate cross-training decisions before a crunch period rather than scrambling after the dependency gap becomes a project delay. This changes the resourcing conversation from "do we have enough capacity for this quarter?" to "do we have enough knowledge coverage?" Those are related questions but not identical ones. For any team with significant single-person dependencies, the second question is often the more consequential.
The sprint planning question shifts, too. A team with dependency risk visibility can identify, three weeks ahead of a critical deployment, that the one engineer who understands the relevant legacy service is scheduled for leave during the deployment window. That is a solvable problem with three weeks of lead time. It is a much harder problem with three days. Most knowledge-gap delays are preventable given sufficient advance visibility. The knowledge exists in the team. The dependency structure is identifiable in advance. The missing piece has consistently been a way to see it before the event that reveals it.
See the knowledge graph in your own team
Brekfuz maps your organization's knowledge dependencies from the tools your team already uses. No manual surveys required.
Book a demo