Feature: Knowledge Graph
A live map of who knows what, built from real work
Brekfuz analyzes commit history, code review activity, Jira ticket ownership, Confluence edits, and Slack participation to construct a real-time graph of expertise across your team.
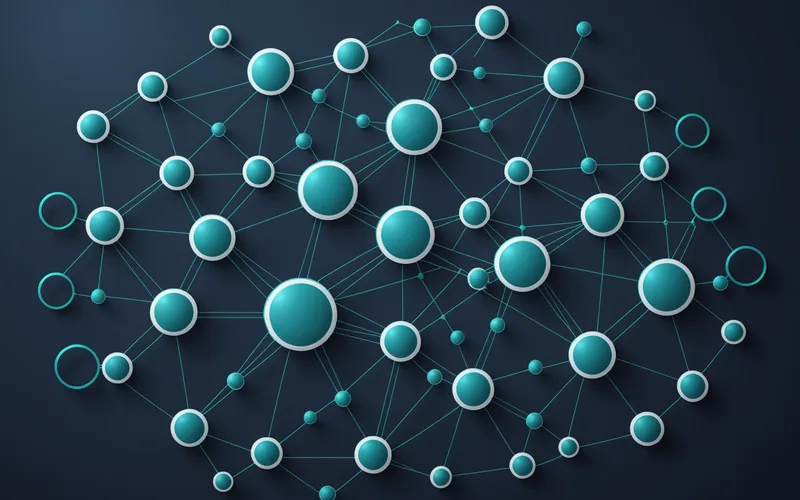
How the graph is built
Graph construction from live signals
Every action a team member takes in your tools leaves a signal. Brekfuz weighs those signals by type, recency, and volume to build a confidence-scored expertise profile for each person.
Code ownership signals
Commit authorship, PR review depth, and code change frequency across file paths and modules. Brekfuz infers domain ownership from the pattern of where each engineer has been spending their time.
Ticket and task signals
Jira assignee history, comment volume by domain, and sprint participation patterns. A person who has touched 90% of tickets in a given domain for six months is statistically its owner, even if no org chart says so.
Documentation contribution
Confluence page authorship, edit frequency, and content freshness scores. Pages that were last edited by one person and are still the canonical reference for a domain are a strong knowledge ownership signal.
Communication patterns
Slack channel participation and response patterns, particularly who answers questions in technical channels. Being the person others turn to for answers is one of the clearest knowledge ownership signals available.
What you see
The knowledge graph interface
Domain map
A visual graph of every knowledge domain in your organization, with node size proportional to how many active projects depend on it. Color coding shows risk level based on ownership concentration.
Person profiles
Click any team member to see their full expertise profile: domains owned, confidence scores, recent signal activity, and which projects would be affected if this person left or went on extended leave.
Export and reports
Export the full knowledge graph as a CSV for HR, succession planning, or reorg workflows. Generate a PDF snapshot of any team's knowledge profile for executive reviews or audit purposes.
See the graph for your team
Book a live demo with your own data
In a 30-minute session, we connect to one of your tool sources and show you the actual knowledge graph for a subset of your team. No preparation required.