Brekfuz Blog
Thinking on knowledge, dependency risk, and team resilience
Writing from the Brekfuz team on how organizations map their knowledge, what happens when that knowledge is undocumented, and how to build operations that do not break when people leave.

How Knowledge Graphs Reduce Project Delays in Enterprise Teams
When engineers go on leave and projects stall, the root cause is almost never the absence of a person. It is the absence of documented knowledge pathways. Here is how mapping those pathways changes the outcome.

The Single-Person Dependency Problem No One Tracks
In every growing team we have worked with, between 15 and 30 percent of critical processes have exactly one person who understands them end to end. This is not an edge case. It is a structural risk that most teams do not measure.

Why Knowledge Transfer Needs to Start Three Months Before Offboarding
The average offboarding process gives one to two weeks to capture everything a departing employee knows. For senior engineers and ops leads, that is not nearly enough time. Here is a better approach.

Tacit Knowledge in Enterprise Software Teams: What It Is and Why It Matters
Most knowledge management discussions focus on explicit knowledge: documentation, wikis, runbooks. Tacit knowledge, which lives in how people actually do their work, is harder to capture and far more valuable.

Onboarding Beyond Documentation: Using Knowledge Graphs to Accelerate New Hires
Documentation tells new hires what to do. A knowledge graph tells them who to talk to, which paths have worked before, and where the undocumented steps live. The difference in time-to-productivity is significant.
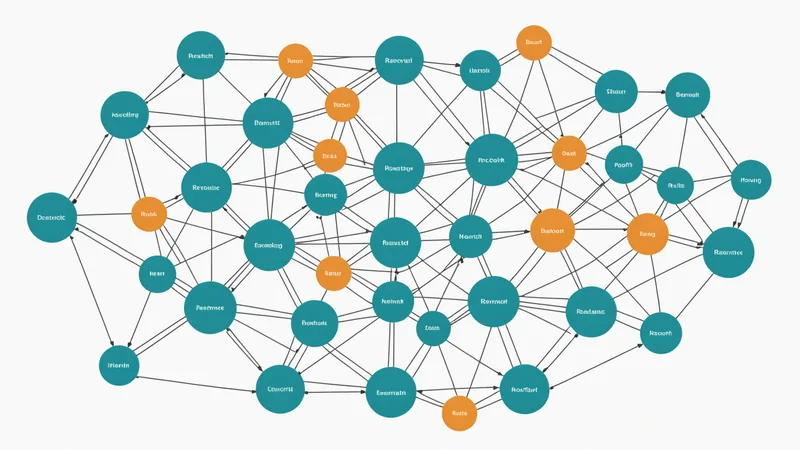
Planning for Operational Continuity During Leave Season
Q4 and summer are when single-person dependencies bite hardest. Pre-planning coverage based on knowledge graphs rather than org charts gives operations teams a measurable advantage.
Graph Databases vs. Wikis: Why Structure Matters for Organizational Knowledge
Wikis store what people chose to write down. Graph databases can store how knowledge actually connects. For understanding dependency risk, the difference is fundamental.
How to Run a Knowledge Health Audit for Your Engineering Org
A knowledge health audit identifies which processes have adequate documentation and cross-training, and which are single-point risks. Here is a repeatable process for running one quarterly.

Reading Knowledge Signals from Slack: What Message Patterns Reveal About Expertise
Slack channels contain an underused signal about who actually understands which systems. The patterns in questions asked and answers given reveal knowledge ownership more accurately than job titles.
Enterprise Knowledge Management in 2025: Where Teams Are Struggling
A look at the most common knowledge management failures we see in enterprise teams, and why the usual tools, wikis, documentation mandates, and training programs, are not solving the underlying problem.

What Happens to Knowledge During a Team Reorganization
Reorganizations realign reporting structures. They do not transfer the knowledge dependencies that built up over years of working together. Understanding that gap is the first step to managing it.

Three Methods for Scoring Knowledge Dependency Risk in Software Teams
Not all single-person dependencies carry the same risk. A methodology for scoring severity based on process criticality, replacement difficulty, and knowledge depth.

Introducing Brekfuz: Map the Knowledge Your Team Actually Runs On
We started building Brekfuz because we kept seeing the same problem: when a key person was unavailable, the whole project stalled. Not because of capacity, but because the knowledge needed to keep going was only in one head. Here is what we are building.